Sensex Expiry Analysis: 82,000 Becomes the Battlefield
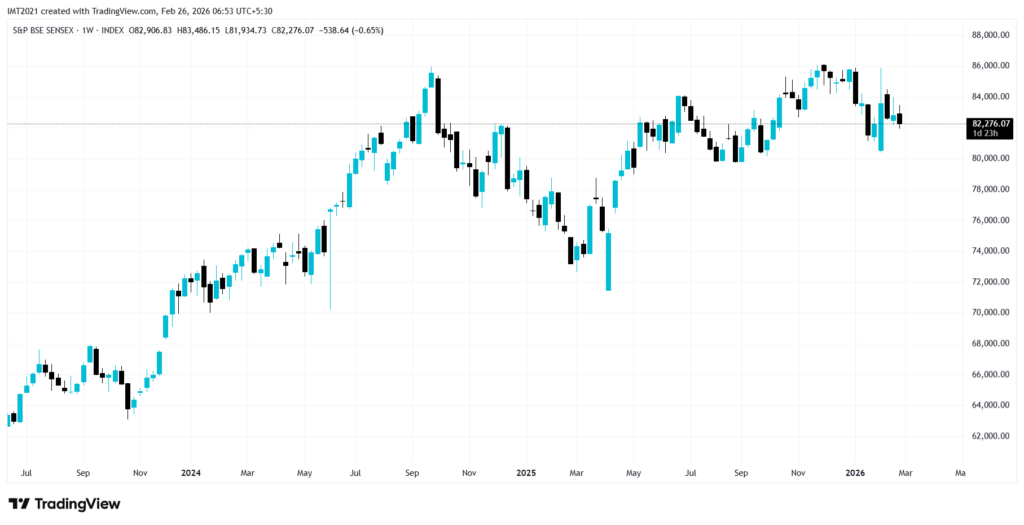
The Sensex is currently trading close to 82,276 levels as we approach the expiry dates, and this puts the Sensex right at a critical technical point on the weekly charts.
Although the headline action may not seem exciting, the technicals indicate that the market is currently consolidating in a larger range of 80,000-86,000.

The big question for traders: will 82,000 resist, or will it break?
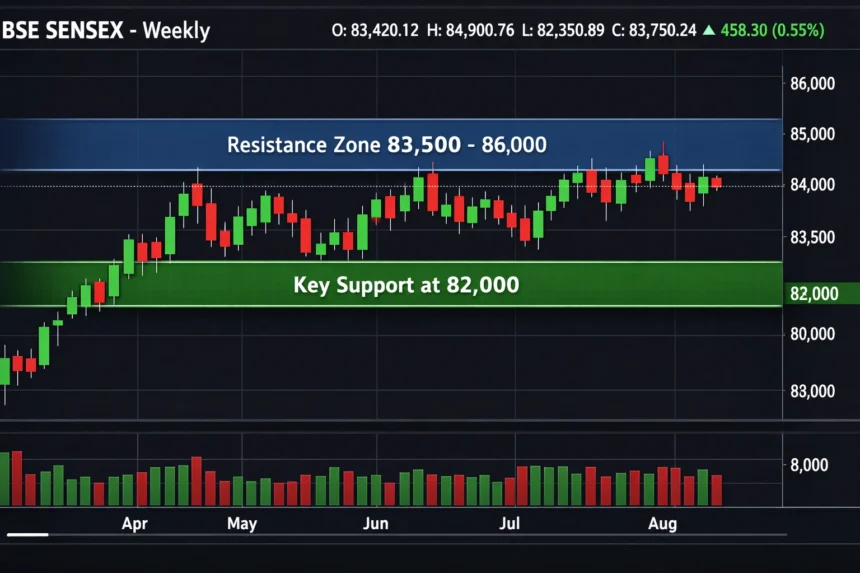
Key Technical Levels From Weekly Chart
On the basis of the chart pattern:
Immediate Support
- 81,900-82,000 zone (Recent weekly low: 81,934)
- Stronger support levels around 80,000
If 81,900 is broken through in a decisive manner during expiry, the downside momentum may continue until 80,000, a level where support was seen from buyers earlier.
Immediate Resistance
- 83,400-83,500 zone (Recent weekly high: 83,486)
- Broad resistance zone around 85,500-86,000
If 83,500 is broken through in a decisive manner, the short covering 85,000+ levels.
Market Structure: Consolidation Before Expansion?
Since the peak around 86,000, the Sensex has been making lower highs while maintaining support at 80,000. This is a sign of consolidation and not a bearish breakdown.
In the past, when markets consolidate within a specific range for several weeks, the subsequent breakout usually has good momentum.
Days around expiration can be catalysts, especially when there are derivative unwinds around important technical levels.
What Traders Should Watch Today
- Reaction at 81,900 support
- Break above 83,500 resistance
- Volume expansion on breakout
- Institutional flow continuation
- Banking sector participation (major Sensex weight)
If the index manages to hold above 82,000 and overcome selling pressure, the bulls may try to recover the higher levels. But if the index breaks below 81,900, the short-term trend may turn negative.
Calm Before the Break?
On the weekly chart, Sensex is not in the panic phase but in the compression phase.
Markets tend to appear directionless before making any big moves. With the expiry of added liquidity shifts, volatility may escalate rapidly once either side of the range is breached.
For now, 82,000 is the level to watch.
Whether this expiry is a trigger for a breakout or just another range-bound day will depend on how markets behave around these levels.
Disclaimer:
This article is for general information purposes only. It is not intended to be or should not be considered investment advice. Investing in the markets carries risks. Trading in derivatives is highly risky and may not be suitable for all investors.
Reviewed for accuracy and last updated on February 26, 2026.