Bitcoin Tests $64,000 Support After Prolonged Downtrend
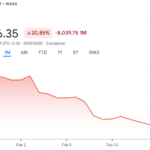
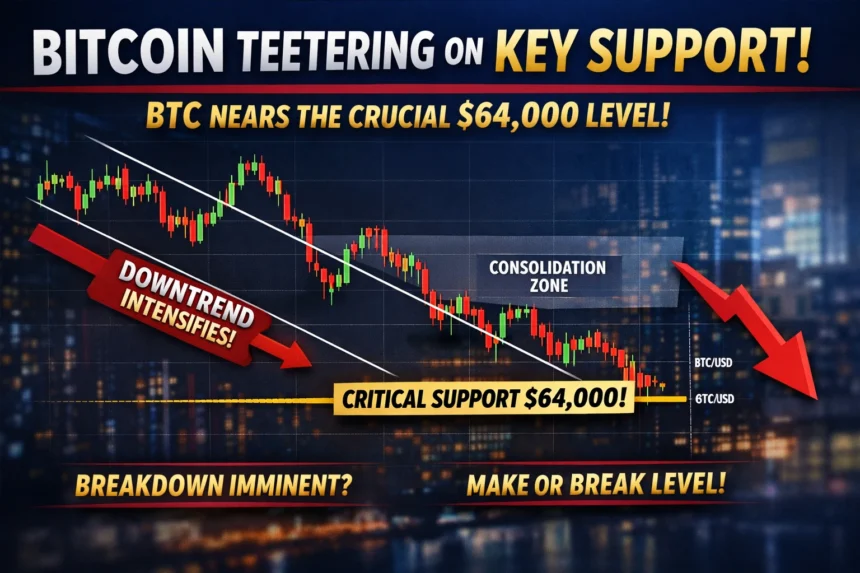
Bitcoin is currently trading close to the $64,000 support level after a prolonged period of correction that started after its October peak above $120,000. The daily chart clearly shows a lower-high, lower-low pattern, which has been in place for the last four months, a clear indication of bearish momentum.
At the time of writing, BTC/USD was trading close to $64,070, down by close to 0.9% on the day.

Technical Analysis : Lower Highs Dominate
The technical analysis points to a strong breakdown that started in November, with each rally unable to recover the previous high. After reaching a strong high above $120,000, Bitcoin made a strong reversal candle, which led to a strong wave of selling pressure.
By December, the technicals clearly turned bearish, with the price falling below the strong psychological level of $100,000. The subsequent attempts to consolidate at $90,000 and $95,000 were unable to create strong buying pressure.
The strongest part of the breakdown is in early February, when Bitcoin fell below $80,000, leading to a strong push towards the current level of $64,000.
Key Levels in Focus
From a technical analysis perspective:
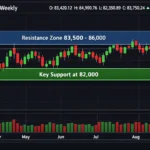
- First support level: $60,000-$62,000 zone
- Psychological support level: $60,000
- First level of resistance: $70,000
- Strong resistance zone: $75,000-$80,000
The $64,000 area is important as it corresponds to a previous zone of consolidation prior to the October surge. A break below $60,000 could lead to the discovery of further retracement spots, while a close above this level could spark short-squeeze rallies.
“Bitcoin is in a correction cycle as part of a larger macro bull trend, but daily momentum is still very weak,” said a digital asset technical analyst.
Momentum and Market Sentiment
The bearish trend is indicative of risk-off sentiment in the crypto markets. In the past, deep corrections after parabolic moves have resulted in protracted periods of consolidation before attempts to reverse the trend.
The fact that volume has been increasing during the breakdown phases is an indication of strong conviction selling, and the recent candles around $64,000 are indicative of lower volatility, which could be a sign of market equilibrium.
Market participants are watching to see if Bitcoin will form a base above $60,000 or if it will continue to make lower highs.
What Traders Are Monitoring
Market watchers are paying attention to these developments:
- Reaction at the $60,000 level of support
- Volume patterns during rallies
- US macroeconomic catalysts
- ETF flow information
- General risk sentiment in the stock market
Bitcoin is still far from its recent peaks but well above its previous cycle lows, thus maintaining the overall structural story despite the current weakness.
The next major action is expected to come out of this $60K-$70K zone.
Disclaimer:
The information provided in this article is for general information purposes only and should not be considered as investment advice. Investing in the market involves risks. Readers are advised to consult qualified financial advisors before making any financial moves.
Reviewed for accuracy and last updated on February 25, 2026.